
Kingworld news 2015/10/01
With many people still wondering if the downside action has been a test of the recent lows, today King World News is pleased to share an extraordinary piece which takes a look at the staggering amount of withdrawals by frightened investors out of mutual funds in the past 3 months as panic recently began to engulf the world. This piece also includes two key illustrations that all KWN readers around the world must see.
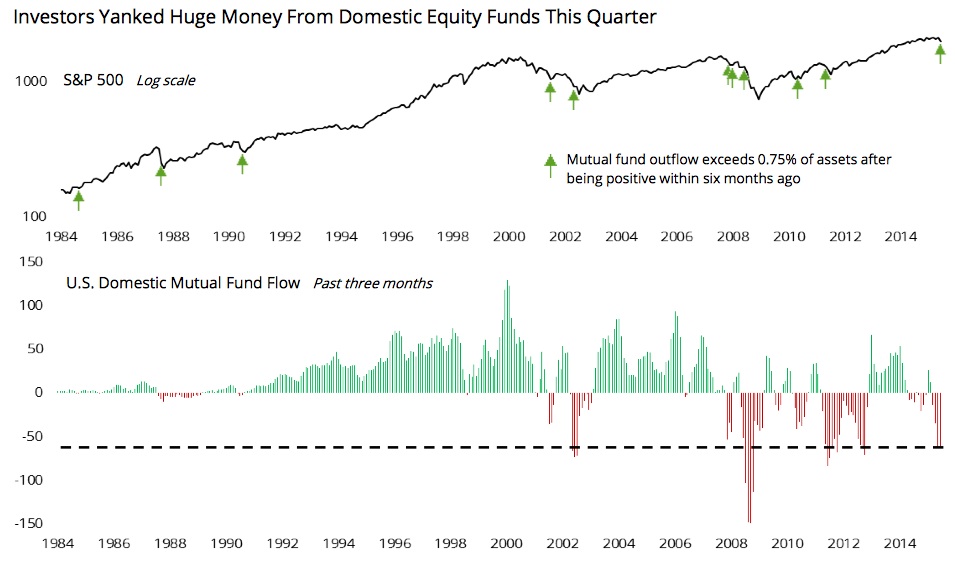
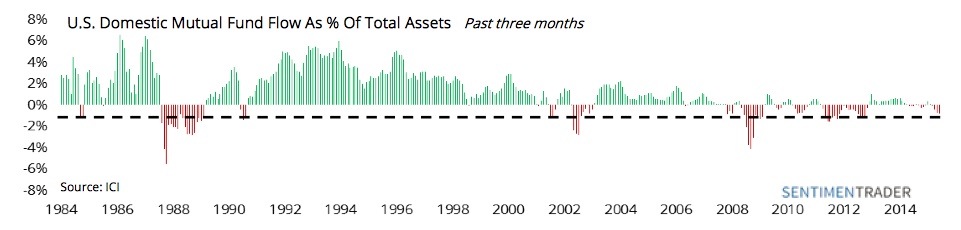
October 1 (King World News) – Jason Goepfert at SentimenTrader: “Investors fled U.S. mutual funds in August. Domestic funds suffered more than $60 billion in outflows over the past three months, among the most severe redemption’s in thirty years. As a percentage of total assets, the damage wasn’t as bad but still ranks as extreme (see chart below).
It’s not news that investors got scared in August.
Many of the indicators that we looked at near month-end were at multi-year or even decade-long extremes of fear and uncertainty.
That manifested itself in investors pulling money from domestic mutual funds, as they yanked money out to protect against another bear market…
SentimenTrader continues: “According to the Investment Company Institute, mutual funds that invest primarily in the U.S. suffered outflows of more than $17 billion in August.
That brings the three-month total flow to negative $63 billion. The last time these funds had this much of an outflow over a three-month period was December 2012 and it ranks among the largest amounts dating to 1984.
Expressed as a percentage of assets, the three-month outflow totals just under 0.8% of assets. That doesn’t seem like much, but it still ranks among the larger outflows over a three-month period.
The arrows on the chart highlight the other times the three-month flow was positive within the past six months, then dropped to -0.75% or worse.
Most of these occurrences marked at least intermediate-term bottoms for stocks, with notable exceptions in 2001 and 2008.
The key, of course, was whether this was a temporary blip during a bull market or the start of an exodus that cascaded into a bear market.
Price structure is the best clue in that regard and so far the evidence is mixed. Stocks are displaying the hallmark signs of a test of a panic low, but there is a clear pattern of lower highs and lower lows. Another lower low, and the bear market thesis has to take precedence.”